USDA Zone Map

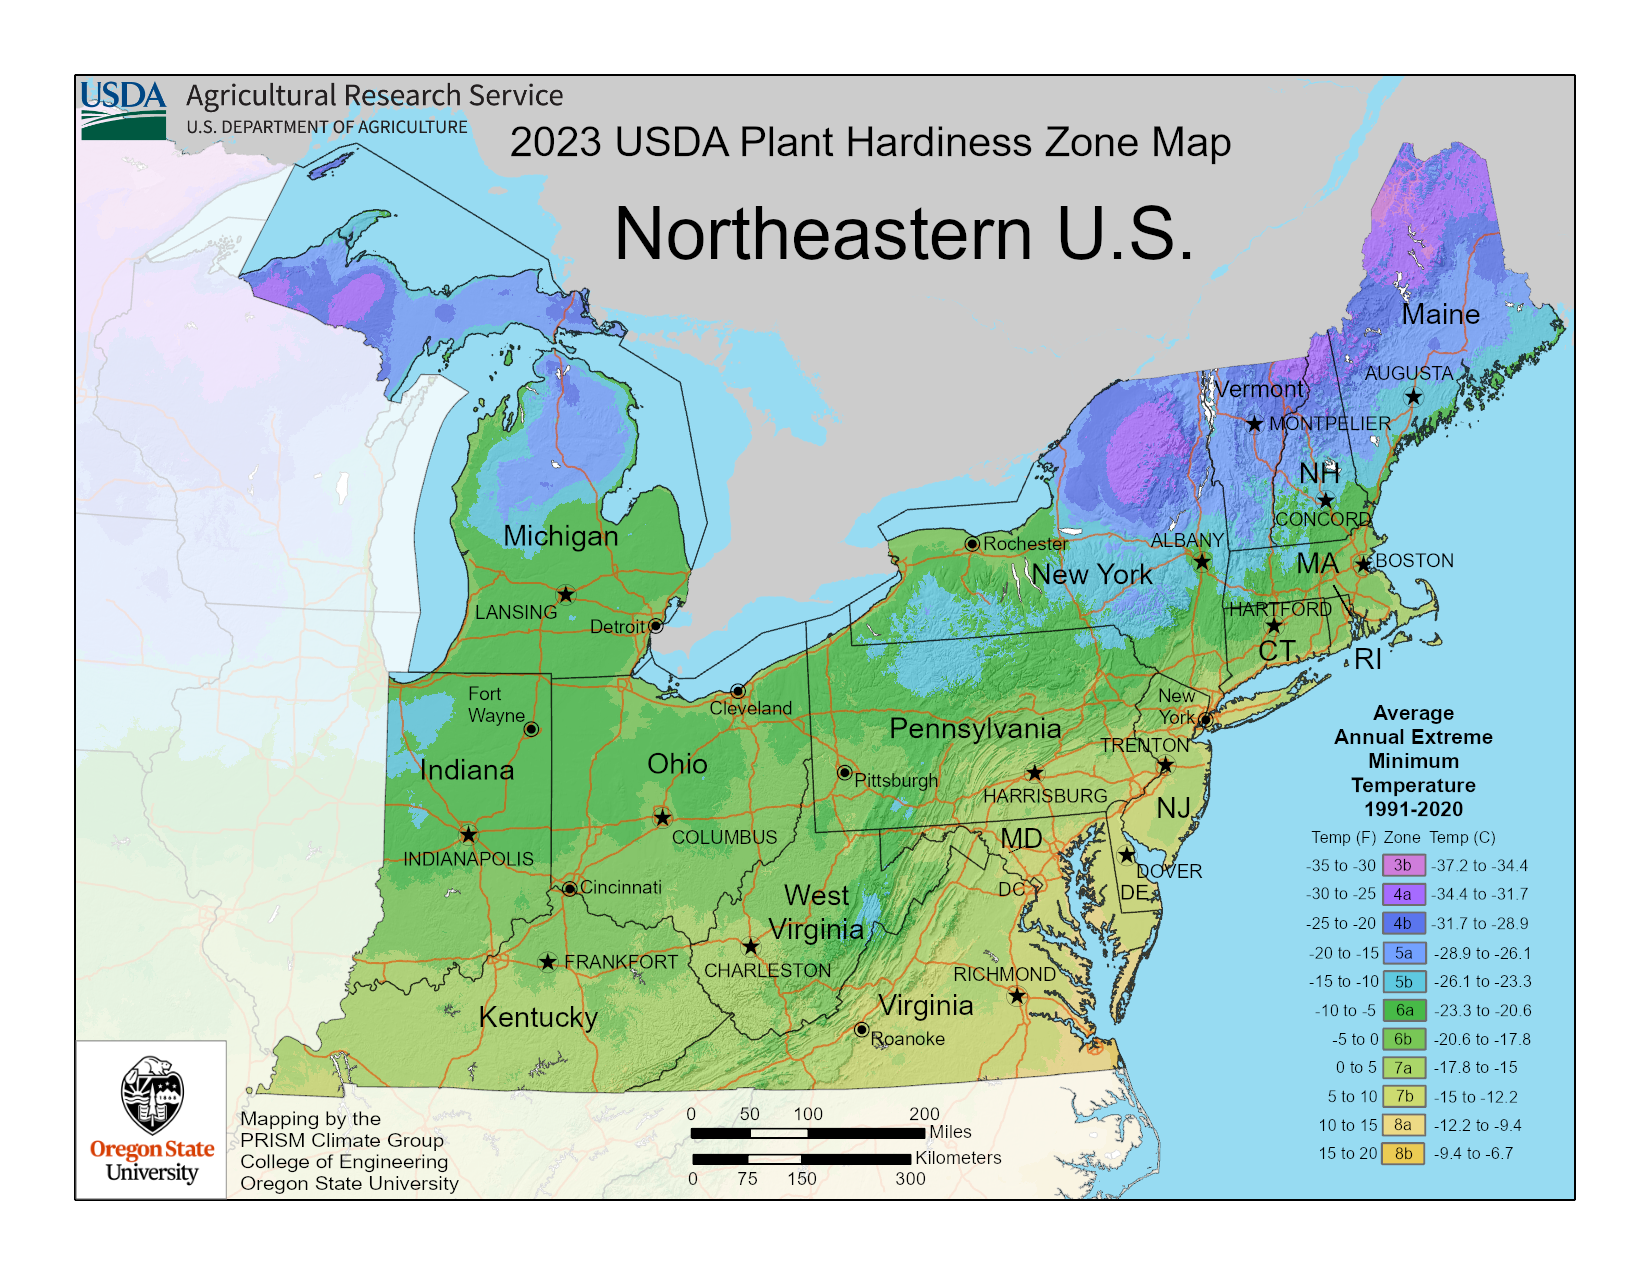

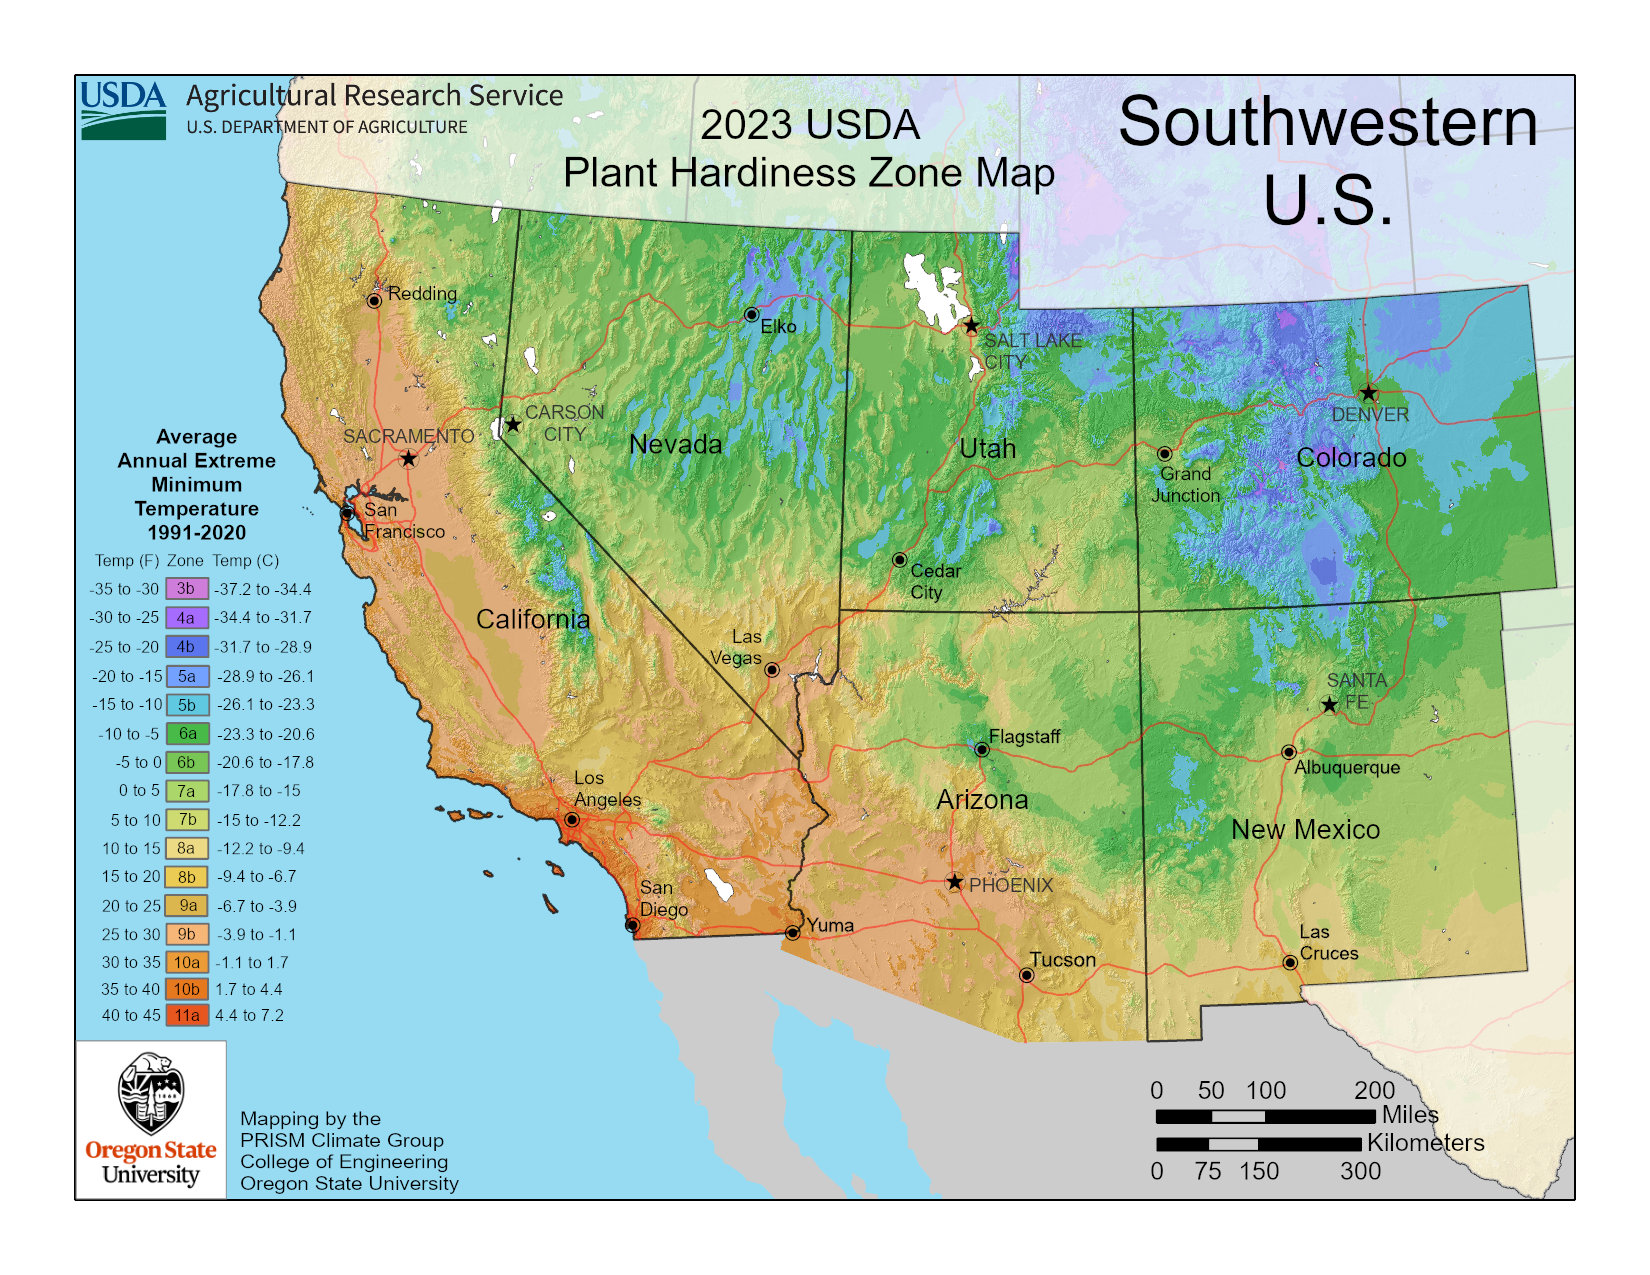
The United States Department of Agriculture (USDA) Plant Hardiness Zone Map is an essential tool for gardeners. It helps determine which plants are most likely to thrive in a location based on the average annual extreme minimum winter temperature. The map is based on 30 years of weather data and is divided into 13 zones, each 10 degrees Fahrenheit warmer or colder than the adjacent zones. Each zone is further divided into “a” and “b” subzones, representing 5-degree Fahrenheit differences. Some cities may even have multiple plant hardiness zones due to variations in elevation or proximity to water.
How the USDA Zone Map is Created
The USDA Plant Hardiness Zone Map is created using a complex process that takes into account various factors, including:
- Average Annual Extreme Minimum Temperature: This is the most crucial factor, representing the average coldest temperature a location experiences each year.
- Elevation: Temperature generally decreases with increasing elevation, so the map considers changes in temperature with altitude. For example, a mountainous region may have several different zones depending on the elevation.
- Coastal Effects: Coastal areas tend to have more moderate temperatures than inland areas, so the map accounts for these differences.
- Temperature Inversions: Temperature inversions occur when a layer of warm air traps colder air near the ground, and the map considers these localized phenomena.
- Topography: The map also considers the effects of topography, such as whether a location is on a ridge top, hillside, or valley bottom. For instance, a valley may experience colder temperatures than a nearby hillside.
The USDA uses a climate mapping technology called PRISM to estimate the average annual extreme minimum temperature for each grid cell on the map. PRISM analyzes data from nearby weather stations, incorporates elevation changes, and accounts for coastal effects, temperature inversions, and topography to create a detailed and accurate map.
Climate patterns are not static; they change over time. The USDA updates the Hardiness Zone Map periodically to reflect these changes. Factors like temperature shifts, the frequency of extreme weather events, and long-term climate trends contribute to these updates. Some changes in zonal boundaries are also the result of using increasingly sophisticated mapping methods and the inclusion of data from more weather stations.
Why Gardeners Should Know Their USDA Zone
Knowing your USDA Plant Hardiness Zone is crucial for successful gardening for several reasons:
- Plant Selection: The most important reason is to select plants that can survive the winter in your area. By choosing plants that are hardy to your zone, you increase their chances of thriving and avoid wasting time and money on plants that are not suited to your climate.
- Bloom and Harvest Times: The length of the growing season varies by zone, affecting when plants will bloom and when fruits and vegetables will be ready to harvest. Knowing your zone helps you plan your garden accordingly and anticipate when to expect your plants to flourish. It also helps you align the growing season, timing and amount of rainfall, and temperature ranges to ensure the plants you are considering are right for the area in which you are planting them.
- Pest and Disease Resistance: Some zones are more prone to specific pests and diseases. Selecting plants adapted to your zone can reduce their susceptibility to these problems.
- Water Requirements: Different zones have varying levels of rainfall and humidity, affecting how much supplemental watering your plants may need. Knowing your zone helps you understand your plants' water requirements and avoid overwatering or underwatering.
- Microclimates: Even within a small garden, there can be significant variations in temperature, sunlight, and other conditions. These "microclimates" can influence which plants will thrive in specific locations within your garden. For example, a south-facing wall might create a warmer microclimate suitable for plants that are slightly less hardy than your overall zone.
- Diverse Plant Needs: It is important to remember that plant hardiness encompasses more than just winter lows. Summer temperatures and precipitation can also be significant stressors. Additionally, some plants need a period of cold or freezing weather to grow, while others thrive in consistently warmer temperatures.
Understanding your planting zone can help you make informed decisions about which type of plants to buy, as well as when to plant them. Knowing when certain plants should be planted allows gardeners to plan and ensure that their gardens are productive throughout the growing season. Additionally, understanding your...source Even experienced gardeners sometimes make these mistakes, so understanding the USDA Zone Map is beneficial for everyone.
How to Use the USDA Zone Map to Choose the Right Plants
Using the USDA Plant Hardiness Zone Map to choose the right plants for your garden is a simple process:
- Find Your Zone: Determine your USDA Plant Hardiness Zone by entering your zip code on the USDA website or consulting a detailed map.
- Check Plant Labels: When selecting plants, look for the hardiness zone information on plant labels or in catalogs. This information usually indicates the range of zones where the plant can typically grow.
- Compare Zones: Compare the plant's hardiness zone range to your zone. If your zone falls within the plant's range or is a higher (warmer) zone, the plant is likely to be hardy in your garden.
- Consider Microclimates: Remember that microclimates within your garden, such as protected areas near walls or under trees, can create slightly warmer or cooler conditions than the overall zone suggests. You may be able to grow plants slightly outside your zone by taking advantage of these microclimates.
- Holistic Approach: In addition to the hardiness zone, consider soil type, sunlight, and moisture requirements before making a purchase.
Limitations of the USDA Zone Map
While the USDA Plant Hardiness Zone Map is a valuable tool, it has some limitations:
- Focus on Minimum Temperature: The map primarily focuses on the average annual extreme minimum winter temperature and does not account for other important factors like average summer temperatures, humidity, rainfall, soil moisture, and the length of the growing season.
- Microclimate Variations: The map cannot capture the full range of microclimate variations within a zone. Even within a small area, there can be significant differences in temperature, sunlight, and soil conditions that can affect plant growth.
- Extreme Weather Events: The map does not account for the increasing frequency of extreme weather events, such as heat waves, droughts, and heavy rainfall, which can significantly impact plant survival.
- Climate Change: Warmer winter temperatures may affect plant survival, increase the prevalence of insect pests and diseases, and alter growing seasons. For example, some fruit trees require a certain amount of cold weather to produce fruit, and warmer winters may disrupt this process.
- Western U.S. Limitations: The limitations of the USDA zones are most felt in the western U.S. where factors like humidity, precipitation, and the length of the growing season can vary significantly. Gardeners in this area may want to consider using the Sunset climate zones, which take these factors into account.
Other Factors to Consider When Choosing Plants
In addition to the USDA Plant Hardiness Zone, gardeners should consider other factors when choosing plants:
- Sunlight: Different plants have different sunlight requirements. Some thrive in full sun, while others prefer shade or partial shade.
- Water: Consider the amount of water available in your garden and choose plants that are appropriate for those conditions. Some plants tolerate drought, while others require consistent moisture.
- Soil: Soil type, drainage, and pH can also affect plant growth. Choose plants that are suited to your soil conditions.
- Wind: Exposure to wind can damage some plants. Consider wind conditions when choosing a location for your plants.
- Temperature Extremes: Consider the range of temperatures your garden experiences, including both summer highs and winter lows.
- Weather Events: Think about the potential impact of weather events, such as snow loads, erosion, and flooding, on your plants.
- Competition: Be aware of competition from existing vegetation, including the roots of nearby trees and shrubs.
- Obstructions: Consider any above-ground wires or obstructions that might affect plant growth.
- Mature Size: Consider the mature size of the plant and ensure it has enough space to grow without overcrowding other plants.
- Aesthetics: Choose plants that you find visually appealing and that complement your overall garden design. Consider factors like growth habit, bloom time and color, foliage color and texture, and winter interest.
The USDA Plant Hardiness Zone Map is a valuable tool for gardeners, providing essential information about the coldest temperatures plants can withstand in a specific location. By understanding their zone and considering other factors like sunlight, water, and soil conditions, gardeners can make informed decisions about plant selection and increase their chances of creating a thriving garden. However, it is important to remember that the map has limitations and does not capture all the nuances of local climate and microclimate variations. Gardeners should use the map as a guide and combine it with their own knowledge and experience to choose the right plants for their gardens.